10 UpSet Plots
UpSet plot will show the relation between different sets. We adopt the part from intervene (Khan and Mathelier 2017) application and modified as required for methylR use.
10.1 How to use
10.1.1 Data upload
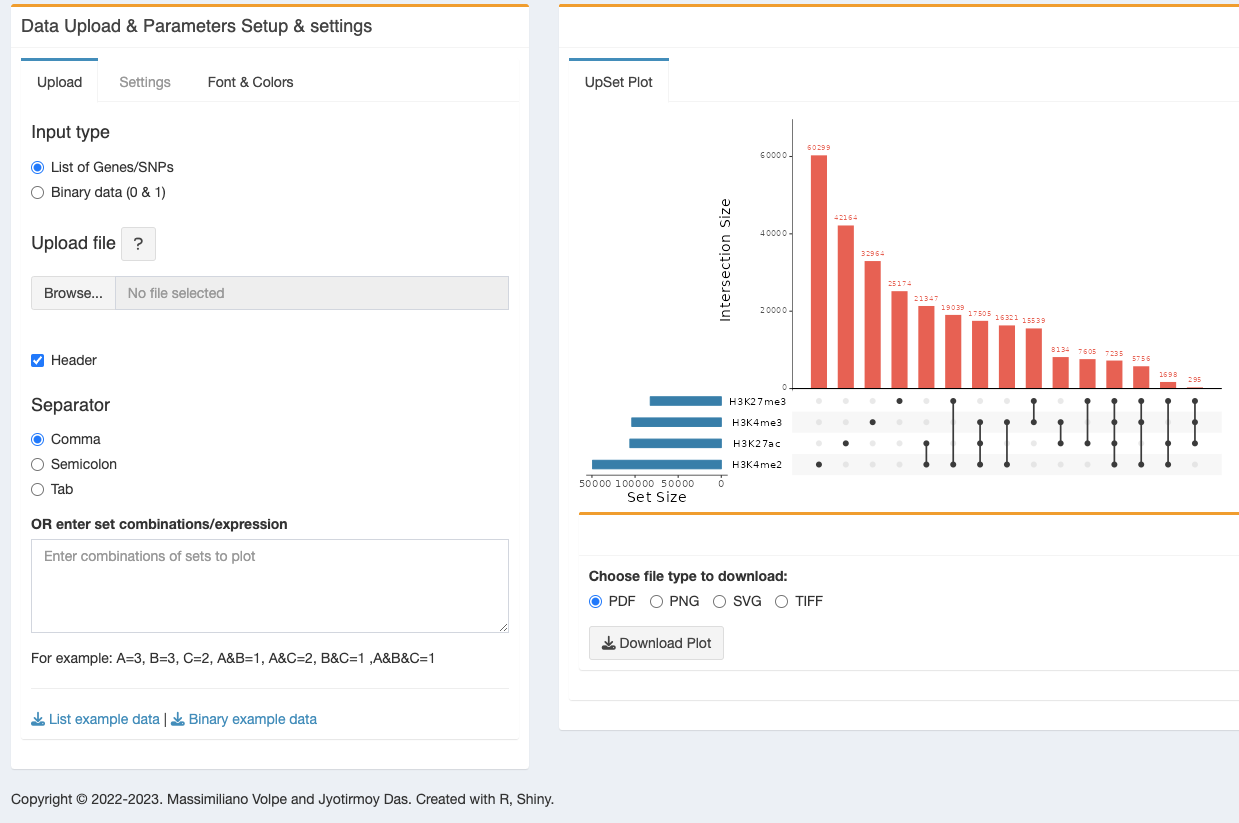
Upload: Data can be uploaded as Tab (.txt) or Comma (.csv) or Semicolon (.csv but with ;) separated format. Please look into the example data file. A demo test dataset is running by default and it is available for download by clicking on the “List example data” button. UpSet module takes three types of inputs.
- List type data: List data is a correctly formatted csv/text file, with lists of names. Each column represents a set, and each row represents an element (names/gene/SNPs). Header names (first row) will be used as set names.
- Binary type data: In the binary input file each column represents a set, and each row represents an element. If a names is in the set then it is represented as a 1, else it is represented as a 0.
- Combination/expression type data: Combination/expression type data is the possible combinations of set intersections.
PLEASE NOTE: “OR enter set combinations/expression” has the priority over “Upload file”. If you use the “set combinations”, and then want to “upload file”, please remove the “set combination” from the input box. To see how the “OR enter set combinations/expression” works, please use the example below the box (not the list/binary example file).
10.1.2 Parameters setup
Settings: there are multiple options to display the plot -
select sets: select the dataset from the input data.
Number of intersections to show: Please add the number to calculate the intersection.
Order intersections by: From the drop-down menu, please select the intersection order -
- Frequency
- degree
Increasing/Decreasing: Please select the order of the frequency/degree.
Scale intersections: Please select the scale intersection from the drop-down menu -
- Original,
- log10,
- log2
- scale sets: Please select the scale intersection from the drop-down menu -
- Original,
- log10,
- log2
Plot width: select the plot width from the slider.
Plot height: select the plot height from the slider.
Bar matrix ratio: select the bar matrix ratio from the slider.
Angle of number on the bar: slider to change the angle of the numbers on the bar.
Connecting point size: change the connecting point size .
Connecting line size: change the connecting line size.
Font & Color: multiple options are included for font and colours -
Select main bar colour: Change colour of the bars of intersection size.
Select set bar colour: Change the set bar colour on the side (set).
Font size of intersection size label: Change the font size of the intersection size.
Set size label font: Change the font size of the set label.
Set size ticks font: Change the tick size (numerical value) on the set size bar.
Intersection size numbers font size: Change the tick size (numerical value) on the intersection set bar.
Set names font size: Change the font size for the set names.
10.2 Result
User can download the figure in different format, PDF, PNG, SVG or TIFF.
10.3 R packages used
TO ALL OUR USERS, IF YOU ARE EXPERIENCING ANY TROUBLE WITH THE APP, BEFORE SENDING THE BUG REPORT, PLEASE RESTART THE DOCKER CONTAINER AND TRY AGAIN.↩︎
Copyright © 2022-2023. Massimiliano Volpe and Jyotirmoy Das.