9 Venn analysis
Venn analysis can be performed to show the logical relation between sets. In this module, user will need two or more analyses (max 6 datasets) to perform the Venn analysis. We adopt the part from intervene (Khan and Mathelier 2017) application and modified as required for methylR use.
9.1 How to use
Below given the details for the use of Venn analysis module.
9.1.1 Data upload & Parameters setup
9.1.1.1 Parameters setup
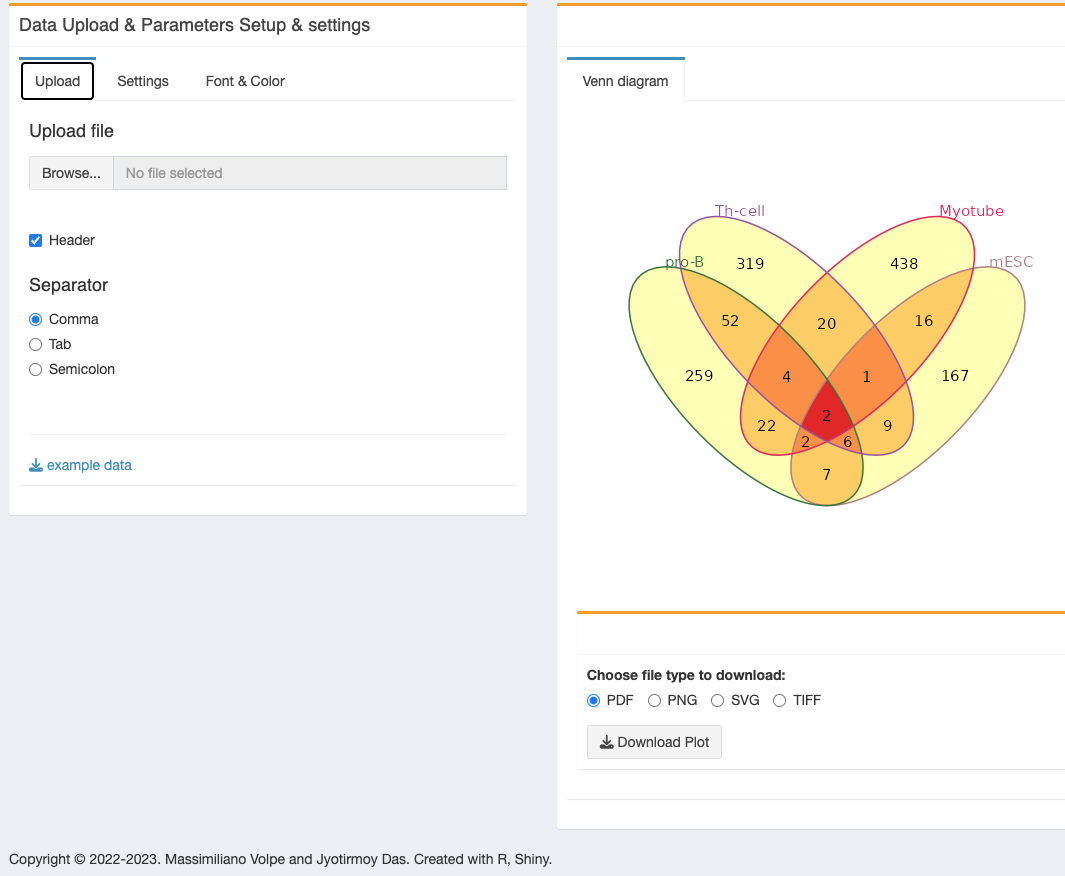
Upload: Data can be uploaded as Tab (.txt) or Comma (.csv) or Semicolon (.csv but with ;) separated format. A demo test dataset is running by default and it is available for download by clicking on the “example data” button.
Settings: Under settings, there are multiple options to display the plot -
- Select sets: will select sets from the uploaded data. User can remove the set as they need.
- Venn type: different type of venn diagram can be selected from the drop-down menu
- Chow-Ruskey
- Classical
- Edwards
- Square
- Battle
The diagram can be weighted or Eular.
Border line width: border line can be drawn with the slider option.
Border line type: border line type can be selected from the drop-down menu.
Zoom in/out Venn diagram: select the zoom option on the slide bar.
Font & Color: multiple ooptions are included for font and colours -
Select color theme: Colour theme can be chosen from the drop-down menu.
Label font size: Change the font size of the Label.
Number font size: Change the font size of the number.
9.2 Results
User can download the figure in different format, PDF, PNG, SVG or TIFF.
9.3 R packages used
TO ALL OUR USERS, IF YOU ARE EXPERIENCING ANY TROUBLE WITH THE APP, BEFORE SENDING THE BUG REPORT, PLEASE RESTART THE DOCKER CONTAINER AND TRY AGAIN.↩︎
Copyright © 2022-2023. Massimiliano Volpe and Jyotirmoy Das.